Statlog Analyser Graphs
The StatLog Analyser generates a series of ten graphs displaying data relating to the following campaign variables:
Agent Wait time (in seconds - cumulative) is the most important measure for most contact center managers. The aim is to minimise agent wait time, and as a result maximise talk time and conversion/completion/collection rates. Factors that influence the agent wait time are:
| Factor | Effect on Wait Time If Higher |
|---|---|
| Target Abandon Rate | Lower |
| Called Party Time to Answer | Higher |
| Ring No Answer Timeout Setting | Higher |
| Call Connect Rate | Lower |
| Agent Talk and Wrap Time | Higher |
| Number of Agents on Campaign | Lower |
| Trunk Lines Available | Lower (if capacity limited) |
The StatLog Graphs display information on each of these factors which can be used to determine whether optimum performance is being achieved and diagnose the cause of lower than expected performance.
Guidance on how to interpret the StatLog Graphs for each of these factors is provided further down this page.

Fig. 1 shows the cumulative average wait time for the example 'Sales' campaign. The wait time starts high and gradually settles to the optimum level of around 7 seconds for this campaign. The gradual increase in wait time to around 9 seconds as the campaign continues is primarily the result of increasing talk and wrap time which can be seen in Fig. 8.
On a predictive campaign the Abandon Rate (% - cumulative average) is a measure of the number of calls Softdial CallGem™ has made for which there is no agent available. Many countries stipulate a maximum number of abandoned calls that may be made, usually expressed as a ratio of live (connected) calls.
In the UK the maximum number of abandoned calls must not exceed 3% of live calls for all types of campaigns (see Abandoned Calls for more details). In some countries (e.g. USA) the limit is higher (5%) and the permitted level of abandoned calls varies according to the type of campaign. For example there is a more lenient limit set for debt collection activities.

Fig. 2 - Abandons causing large spike at start
The Abandon Rate graph shows the cumulative average value so the most important value is the one at the end of the campaign. In the example 'Sales' campaign graph (Fig. 2), there has been some early abandoned calls which have pushed up the running average. This can happen if one or more calls are abandoned near the start of the campaign, when the number of live calls is still low. The dialer will adjust its dialing rate to bring the Abandon Rate within limits very quickly.
It is unusual to get abandoned calls so soon after the start of the campaign. Fig. 3 illustrates a more typical scenario - in this case the target Abandon Rate has been set to 5%.
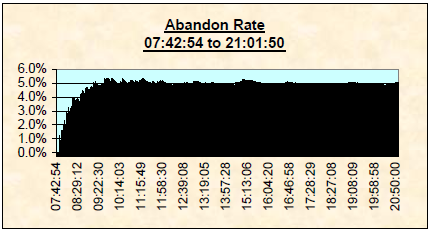
Fig. 3 - Typical Abandon Rate profile
Occasionally the cumulative Abandon Rate value may stray slightly over the limit. This can happen if there are sudden changes to any of the campaign conditions that can induce abandoned calls. Examples of these are:
The dialer's call pacing engine relies on, among other things, an accurate 'forecast' of the number of agents that will be available to handle the calls it is launching. Any sudden reduction in the number of available agents can mean there are not enough agents available to service the resulting live calls.
For this reason, Softdial CallGem™ imposes a strict process for releasing agents from the agent 'pool'. An agent who wishes to leave the pool must first notify Softdial CallGem™ that he/she wishes to go unavailable. Softdial CallGem™ will adjust the dialing rate accordingly and only when it has done this will it release the agent. Agents leaving the pool in an uncontrolled manner (e.g. by simply closing their browser window or hanging up their nailed up connection) is the most common cause of sub-optimal campaign performance. The increased abandon rate will cause Softdial CallGem™ to adjust its call pacing to compensate thereby reducing the call launch rate which can result in increased agent wait times.
Just as a sudden reduction in available agents can generate abandoned calls, a sudden and excessive increase in connect rate can also mean there are more live calls than there are agents to service them. Softdial CallGem™ adjusts its call pacing based on the running connect rate and will cope with reasonably high levels of fluctuation in connect rate. However any sudden and excessive increase in connect rate can result in a flurry of abandoned calls.
The most common cause of connect rate increase of this kind is when all agents set the same time for callbacks. Since pre-arranged callbacks have a much higher chance of being answered, this can result in the connect rate jumping by 20%, 30% or even 40% in a matter of seconds. Iimprovements have been introduced to Softdial CallGem™ software to better handle this kind of behaviour, however best practice is to ensure that callbacks are evenly distributed in 10 or 15 minute blocks.
Another common cause of variable connect rate is when the campaign list has not been randomised. In extreme situations where the list has records with a common local exchange number in order, this can result in the local network being saturated causing a sudden batch of 'fast busy' outcomes. Alternatively, a list that groups demographic types in order can cause a sudden change in connect rate as the campaign progresses from one group of contacts to the next. For example, if the list is ordered by age, the connect rate may suddenly increase when the list progresses past the local retirement age.
This is usually related to the increased connect rate as described above and can compound the effect, particularly if the campaign is running with a relatively low connect rate and when a connect can result in a lengthy talk / wrap time (e.g. with market research campaigns).
Where the abandon rate does drift above the permitted limit, Softdial CallGem™ will quickly adjust its dialer pacing to bring it back within limits again as fast as possible, however this may be at the expense of agent wait time performance. For optimum campaign performance, strict control of agent availability / logout behaviour and sensible callback scheduling is critical.
This is the average time (in seconds - cumulative) between the called party's phone starting to ring and them picking up the phone (Fig. 4). Note that this excludes any network delays between the call being 'launched' to the network by Softdial CallGem™ and the called party's phone actually ringing.
There is a 'universal average' time to answer which appears to be consistent around the world. This is roughly equivalent to 3 rings which takes between 15 and 18 seconds, depending on the particular ring tone sequence.

Fig. 4 - Average Time to Answer
The average time to answer may be higher or lower than this on specific campaigns depending on the campaign demographic, for example:
- A campaign targetting businesses (B to B) may have a lower average time to answer since businesses tend to answer more quickly than private individuals.
- A campaign targetting pensioners / infirm people may have a higher average time to answer as they may take longer to answer the phone.
Another factor that may affect the average time to answer is when the Ring No Answer timeout is set such that answering machines can be detected, for example in order to leave a message. Typically this means setting the RNA to allow for 5 rings - around 22 to 26 seconds. On campaigns with a high percentage of answering machine outcomes the average time to answer may be considerably higher than 15 seconds (Fig. 6). For more information on the effect of using answering machine detection on campaign performance see Answering Machine Detection and Performance Deployment Issues.
As explained in the Time to Answer section, the RNA setting should normally be set to 18 seconds for optimum campaign performance. Exceptions to this may be where it is necessary to leave a message on answering machines (e.g. collections campaigns) or for market research campaigns where the campaign demographic must include people who may take longer to answer the phone (e.g. old / disabled / infirm).

Fig. 5 - RNA set to 26 seconds to allow agent to leave an answering machine message
There is a common misconception that increasing the RNA time setting increases the connect rate and therefore improves campaign performance. Whilst an increased RNA may well capture a few more connects that would be lost with a lower RNA setting, the downside is that for the majority of non connects (typically 60% of call attempts) this has the effect of increasing the overall call cycle time, reducing the calling rate and significantly lowering overall performance.
To guage the commercial impact of a higher RNA setting, run a like for like test with the RNA set to 18 seconds and with it set higher. You may be surprised at the results. See also the Live Distribution Analysis tool which can be used to help analyse the results of your tests.
Fig. 6 illustrates what can happen if the RNA time is set too high. Note the effect on Average time to answer.

Note this test was for illustration purposes only - in practice we do not recommend setting the RNA higher than 22 seconds due to the adverse impact on campaign performance.
Connect Rate (cumulative %) is the percentage of launched calls that result in a live connect between an agent and the called party. Low Connect Rate is probably the most common reason for poor predictive campaign performance. This can be the result of poor list quality e.g. the list contains a large percentage of invalid/ unobtainable numbers, or network issues inhibiting connection.
From experience, the typical connect rate for a suitably randomised list should be around 40% to 60%, although this can vary considerably depending on factors such as calling time, demographic and network performance.

Fig. 7 shows a campaign with a healthy 50% - 60% connect rate. Note the sudden dip in connect rate at around 19:40 as a result of a sudden network issue limiting the number of connects. The effects of this can most clearly be seen in the Agents Waiting Graph (Fig. 9) and the Trunk Lines In Use Graph (Fig. 11).
Note that the StatLog Graphing algorithm limits the connect rate displayed to a minimum 15%; if your connect rate is flatlining at 15% on the graph it is likely to be much lower than 15%.
Long talk and wrap time severely limit the benefits that can be obtained from a predictive dialer. Predictive dialers deliver their advantage by 'hiding' the percentage of the total call cycle time that relates to the 'calling time'. If the calling time is a low percentage of the total call cycle time, as is the case when the talk and wrap time is high, the benefit obtained from predictive dialing is also low. As a general rule, if the talk and wrap time is more than 80% of the total call cycle time, there will be little if any productivity gain from using a predictive dialer.

Fig. 8 - Average Talk and Wrap
The talk and wrap time displayed in the StatLog Graphs (in seconds - cumulative) will reflect increases in the connect rate - more agents spending time talking to contacts. Fig. 8 shows the Talk and Wrap Time Graph for the 'Sales' campaign. Note the sharp drop in talk and wrap time occuring around 16:15. This was caused by supervisor action limiting the time agents were spending in wrap. Note the corresponding increase in connect rate (Fig. 7) as Softdial CallGem™ adjusts to the new conditions.
The average number of agents waiting at any time (Fig. 9) is directly related to the wait time shown in Fig. 1. Note that the Wait Time Graph shows cummulative average data hence there is no spike matching the one that occurs around 19:40 in the Agents Waiting graph. As you can probably guess, this spike is caused by the combination of a network issue restricting the number of connects and 20 agents logging into the campaign at around the same time.

This graph shows the number of agents who are logged into the campaign throughout the period covered by the statlog. In Fig. 10 we can see the effect of shift changes and agent breaks. As discussed earlier in the Abandon Rate section, as long as agents are exiting from the pool in a controlled manner, there will be no adverse effect on the abandon rate or campaign performance (other than the natural effect of having a fewer agents on the campaign).

This graph shows the number of trunk lines being used by Softdial CallGem™ throughout the period covered by the statlog. Notice the correlation between this graph (Fig. 11) and the Available Agents graph (Fig. 10).

Under normal campaign conditions (e.g. abandon rate = 3%+, connect rate = 30%+, 10+ agents and reasonable talk and wrap times) you should expect to see the number of trunk lines in use between 1.5 and 2 times the number of available agents.
Fig. 11 also clearly shows the effect of the sudden reduction in connect rate that occurs around 19:40 (Fig. 7). Here we can see Softdial CallGem™ trying to compensate by rapidly increasing the number of calls launched.
This illustrates an interesting point about the importance of getting accurate feedback from the network in this situation. If the network restricts the number of calls that can be progressed, it should respond with a 'fast busy' notification to the telephony system and this information must be passed back to Softdial CallGem™. When Softdial CallGem™ receives this information, instead of increasing the call launch rate, it will actually temporarily suppress it in order to avoid compounding the problem by further saturating the network.
The behaviour that is evident from analysing the Connect Rate and Trunk Lines in Use graphs would suggest that Softdial CallGem™ was not receiving any fast busy notification from the network in this case.
The telephony system should notify Softdial CallGem™ how many trunks are available for it to utilise for the campaign. If the number of available trunks changes during the campaign this change should also be notified to Softdial CallGem™. If this information is accurate and there is no change to the number of available trunks during the life of the campaign, there should never be a situation where calls are launched by Softdial CallGem™ to the telephony layer when there are insufficient trunks available. Fig. 12 shows what you should normally see in this graph.

Fig. 12 - Calls Awaiting Trunks
If the telephony layer reports inaccurate information to Softdial CallGem™ then Softdial CallGem™ may attempt to launch more calls to the telephony layer than it can handle. In this case this graph will indicate when this condition occurs. Fig. 13 is an example of the Trunk Lines In Use and Calls Awaiting trunks Graphs illustrating a shortage of trunks.

Fig. 13 - Example of Trunk Shortage showing effect on Trunk Lines In Use and Calls Awaiting Trunks Graphs
A high resolution PDF of the StatLog graphs discussed in this section is available for download here.